Spring Boot Admin 监控工具
参考资料 Spring Boot Admin 官方文档 参考资料 SpringBoot之程序性能监控 参考资料 springboot 监控 Actuator和Admin
Spring Boot Admin 是什么
Actuator 是 Spring boot 的一个附加功能,可以在应用程序生产环境时监视和管理应用程序。可以使用 HTTP 的各种请求来监管,审计,收集应用的运行情况。Spring Boot Actuator 提供了对单个 Spring Boot 的监控,信息包含:应用状态、内存、线程、堆栈等等,比较全面的监控了 Spring Boot 应用的整个生命周期。特别对于微服务管理十分有意义。
但是它没有可视化界面。所以可以使用下面这个 Spring Boot Admin
Spring Boot Admin 是一个针对 Spring-boot 的 actuator 接口进行 UI 美化封装的监控工具。他可以返回在列表中浏览所有被监控 spring-boot 项目的基本信息比如:Spring 容器管理的所有的 bean、详细的 Health 信息、内存信息、JVM 信息、垃圾回收信息、各种配置信息(比如数据源、缓存列表和命中率)等,Threads 线程管理,Environment 管理等。
Spring Boot Admin 是由 Client 端和 Server 端组成,在 Spring Boot 项目中,Spring Boot Admin 作为 Server 端,其他的要被监控的应用作为 Client 端, 基于这种的配置如下步骤:
搭建 Server 端
首先创建一个 Spring Boot Admin Server,首先需要创建一个基本的 Spring Boot 应用程序,这个就不做赘述了,并加入以下依赖:
<!-- 不要用错了,使用的是这个启动器 -->
<dependency>
    <groupId>de.codecentric</groupId>
    <artifactId>spring-boot-admin-starter-server</artifactId>
    <version>2.3.1</version>
</dependency>

<dependency>
    <groupId>org.springframework.boot</groupId>
    <artifactId>spring-boot-starter-web</artifactId>
</dependency>
在启动类上加上如下注解
@SpringBootApplication
@EnableAdminServer
public class HtsApplication {

  public static void main(String[] args) {
    SpringApplication.run(HtsApplication.class, args);
  }
}
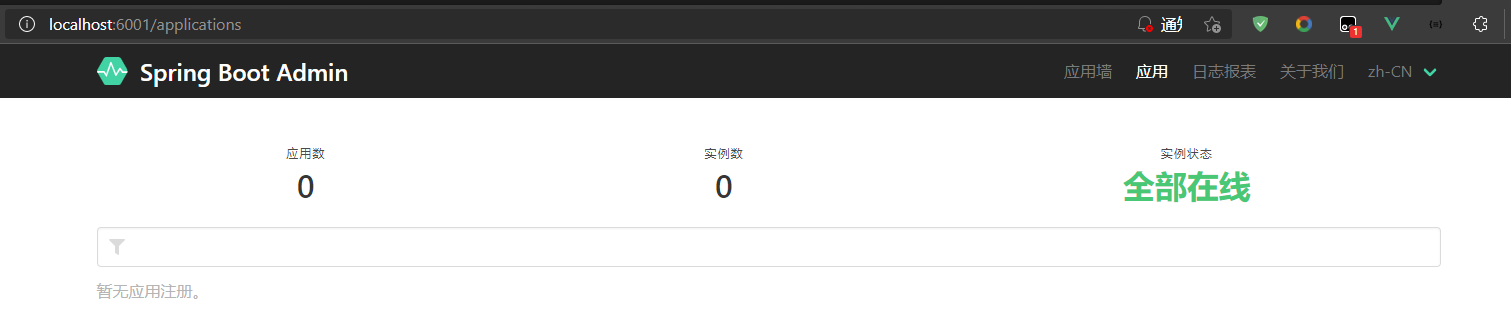
启动后就能看到如下这个界面了
在任意需要被监控的 Spring Boot 应用程序上添加依赖,最后启动客户端,其中 Spring Boot Admin Server 从 Eureka 上拿到注册信息后完成认证
配置 Client 端
<dependency>
    <groupId>de.codecentric</groupId>
    <artifactId>spring-boot-admin-starter-client</artifactId>
    <version>2.3.1</version>
</dependency>

<dependency>
    <groupId>org.springframework.boot</groupId>
    <artifactId>spring-boot-starter-web</artifactId>
</dependency>

<dependency>
    <groupId>org.springframework.boot</groupId>
    <artifactId>spring-boot-starter-actuator</artifactId>
</dependency>
编写配置文件
server:
  port: 8080
# 自定义配置信息用于 "/actuator/info" 读取
info:
  name: Alice
  age: 100
  phone: 110

# 通过下面的配置启用所有的监控端点,默认情况下,这些端点是禁用的;
management:
  endpoints:
    web:
      exposure:
        include: "*"
  endpoint:
    health:
      show-details: always

# 将 Client 作为服务注册到 Server,通过 Server 来监听项目的运行情况
spring:
  boot:
    admin:
      client:
        url: http://localhost:8081 # 服务器的地址
        instance: # 额外注册一个实例
          #默认使用的是主机名注册,改为使用ip注册
          prefer-ip: true
          name: "instance_A"
  # application实例名
  application:
    name : spring-boot-admin-client
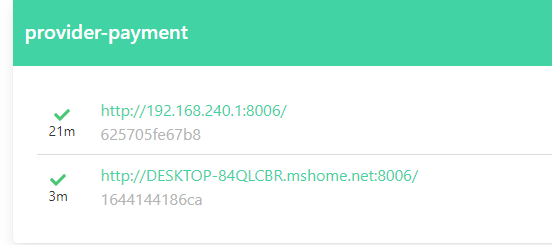
然后就能在服务端的监控界面看见注册的配置了
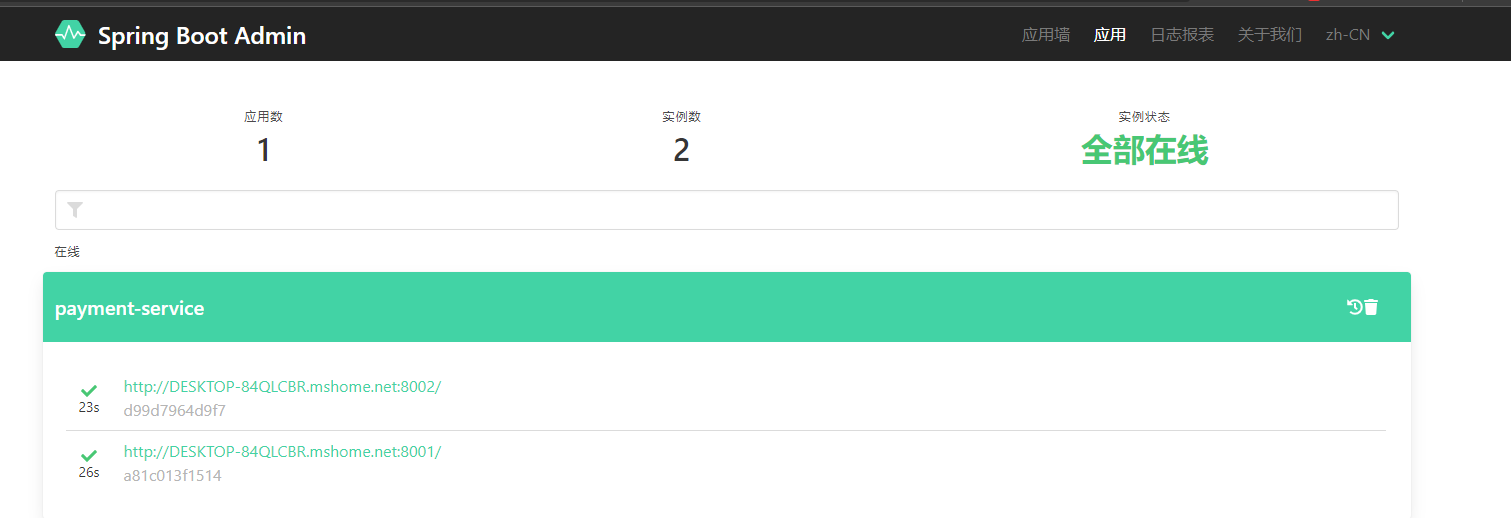
点进去就能看到每个服务的详细信息了(注意,可能要等上几秒才行)

上面那个 instance 可以详细的配置当前服务的实例
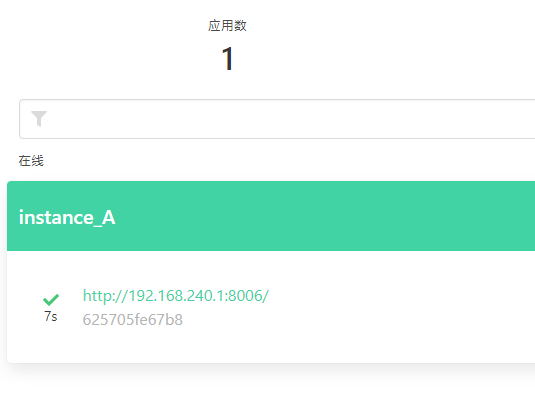
注意:如果之前那个服务挂掉了,再重新启动,可能会出现这种一个服务多个实例的情况